Main User Interface#
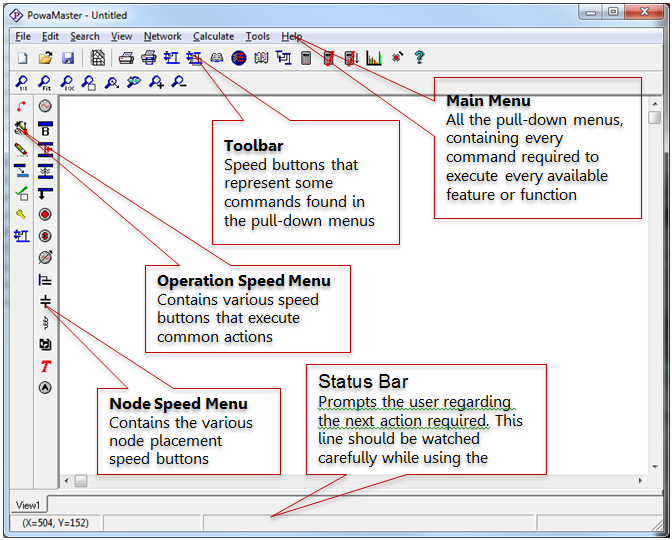
Network Creation#
| Icons | Icons |
|---|---|
Network Manipulation#
| Icons | Icons |
|---|---|
Network Analysis#
PowaMaster supported calculation methods:
- Newton-Rhapson
- Gauss-Seidel
Reporting#
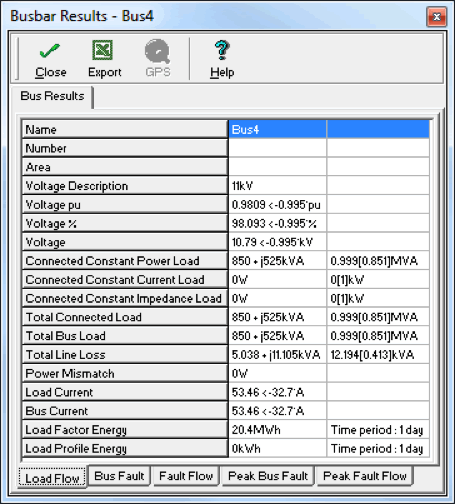
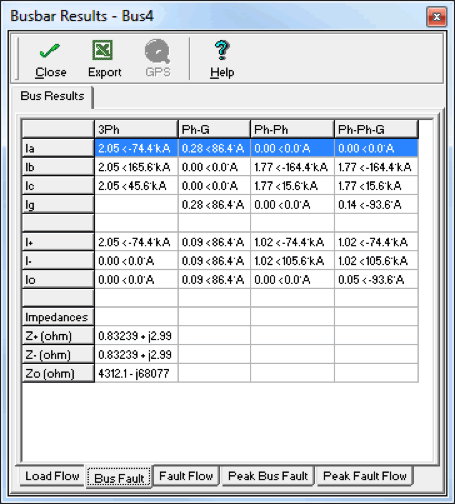
Reporting is user definable. This is an example of a busbar report: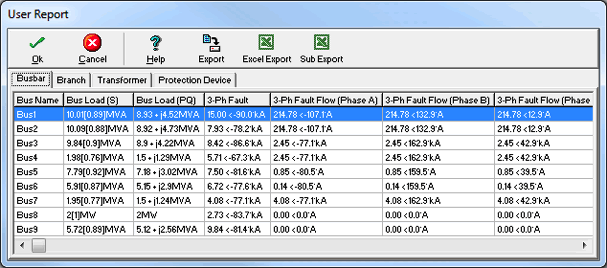
There are some 84 individual busbar parameters that can be selected as part of the report. Typical parameter attributes include, Bus Load (S), Bus Load (PQ), Load current, Voltage %, 3-Ph Fault Flow (Phase A), Line Losses (PQ).
Similar reports can be created for Branches, Transformers and protection devices.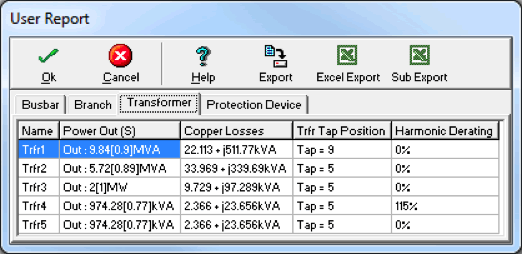
Load Profile Analysis (Time Series Analysis)#
PowaMaster contains the powerful feature of being able to perform load profile calculations. Where the user has collected field data from several locations across the network, this information can be rapidly imported into PowaMaster in order to perform load flow calculations over the period measured.
Load Categories allow the User to “lump” loads that have similar properties together. The category attributes can then be modified as a group, changing scale factors and their coincidence factors.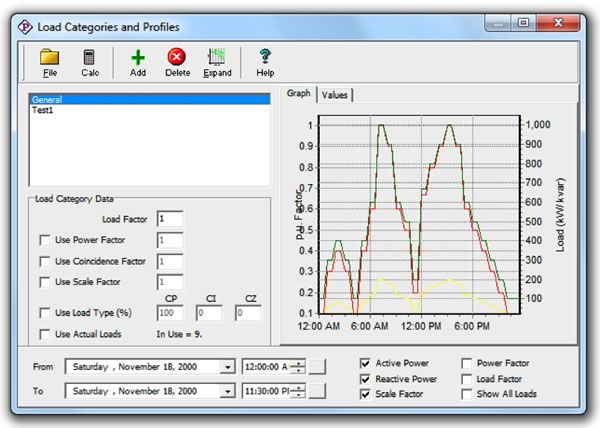
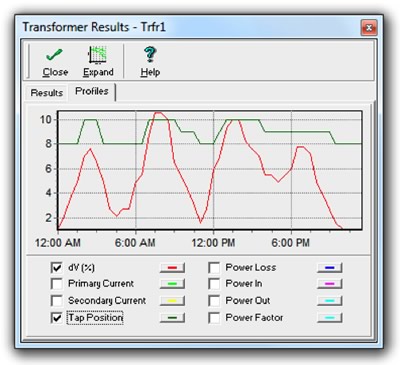
Results#
All the relevant transient and static information is available at each node in the network, whether it be a busbar, transformer, protection device, cable or load device.
Load Currents#
Fault Currents#
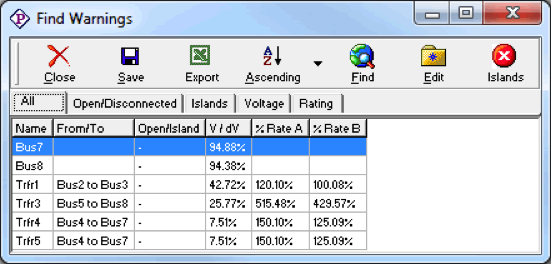
Network Anomalies#
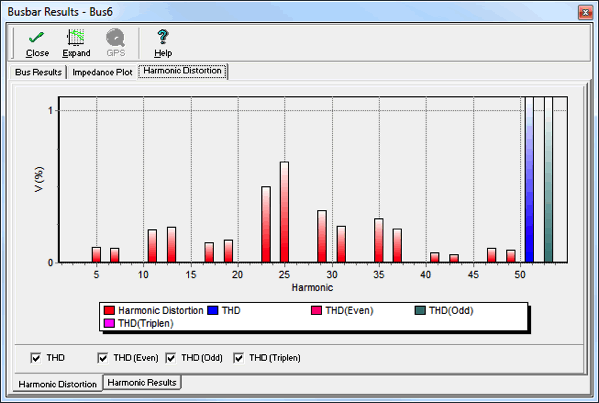
Harmonic Analysis#
PowaMaster incorporates harmonics analysis. This facilitates the simulation of variable speed drives and other electronic motor controllers.